Why Did Bryce Harper Get the Largest Contract In MLB History?

This afternoon, Bryce Harper finally ended his lengthy stay in free agency with a 13-year, $330 million contract with the Philadelphia Phillies. It is the largest contract in MLB history: the largest in guaranteed money, and tied for the longest ever signed alongside then-Miami Marlin now New York Yankee Giancarlo Stanton.

I’ve heard what I’ve expected to hear based on the reaction to this deal: “apparently hitting .249 now nets you $330 million”, “the Phillies grossly overpaid”, “I’m not going to be able to afford tickets to the ballpark now”, and “Manny Machado was better last year.” I want to address each of these in a clear and concise way, while adding my own commentary as to why Bryce is actually deserving of such a contract.

Bryce Harper, cleverly photoshopped into his new jersey with his new team, the Philadelphia Phillies.

“He Only Hit .249 Last Year”

Let’s dispel the fiction that batting average matters right here, right now. If you’ve taken the time to read my lengthy Statistics In Baseball: An Endless Debate essay (and thank you if you did!), I very clearly spell out that batting average is an extremely flawed statistic and doesn’t deserve much in the way of credibly demonstrating offensive ability.

First and foremost, batting average completely ignores every other possible outcome that allows an offensive player to reach base: walks, hit-by-pitch, catcher interference, and errors are all taken out of the equation to compile the statistic, and there is a lot of missing value that gets overlooked when simply looking at batting average alone. Comparing two hitters with the same batting average, and including all of their other stats, you can clearly see that two hitters that have the same batting average are not the same.

Last year, two hitters that qualified for the batting title hit .249: Bryce Harper and the Chicago Cubs’ catcher Wilson Contreras.

Yes, they both hit .249, but Bryce got on base at a much higher clip (.393 to Contreras’ .339) and slugged at a much higher rate as well (.496 vs. .390). There isn’t much debate: Harper very clearly did more with his plate appearances than Contreras, and his hits were clearly more valuable, too, as he hit far more doubles, triples, and home runs with his at-bats than Contreras did. No question, Bryce Harper was the better hitter. Two .249 batting averages are not created equal.

Never mind that he was a .300 hitter in the second half of the season, and has traditionally hit about .280 his entire career. Next.

“The Phillies Grossly Overpaid”

Eh, not really. Not the way that this contract is structured, anyway. Bryce will earn a $10 million salary this year on top of a $20 million signing bonus. He then will make $26 million annually from 2020-2028 and then $22 million annually from 2029-2032.

Yeah, sure, ages 36-39 he’ll be making $22 million, but compare that to Miguel Cabrera, who will make $30 million per year until he’s 42. The Phillies will comparatively save $32 million over the course of those four years compared to Cabrera’s deal, and he will be three years younger when his contract expires. Next.

“I’m Not Going to Be Able to Afford Tickets to the Ballpark Anymore.”

Stop. MLB ticket prices only went up by 4.6% this year using Statista and running a simple percentage growth calculation. Yes, MLB’s revenue has risen an astronomical rate over the past 20 years (which actually further solidifies Bryce Harper’s case for a large contract), but MLB ticketing revenue has stayed pretty much stagnant.

Fans still rely on relative affordability to make it to the ballpark, and MLB teams acknowledge that. Rest easy knowing that Bryce Harper’s massive contract does not directly correlate to your ticket price. In fact, if attendance figures don’t improve this year compared to last, it would not surprise me to see ticket prices actually come down a touch in 2020.

“Manny Machado Was Better Last Year.”

Demonstrably so, and he was rewarded handsomely with a 10-year, $300 million contract with the San Diego Padres. However, there are a few significant things that Bryce brings to the table that Manny does not:

-Rookie of the Year Award

-MVP Award

-Six All-Star Game appearances to Manny’s four

-Endorsements with Gatorade, Underarmour, Warrior Eye Black, and New Era. Machado has zero.

The accolades and the endorsements overwhelmingly paint Harper as the far more marketable player than Machado. Bryce has far more marketing potential as the face of a franchise than Manny does, and it’s not even close.

Nonetheless, both Harper and Machado and their respective new teams will be a lot of fun to watch in both 2019 and the seasons to come.

Blast From The Past: Statistics Essay From Undergrad, an Introduction

Six years ago, I was a junior at Grand Valley State University. I was taking a sports’ journalism class that required a thoroughly researched and detailed topic that was affecting the world of sports at the time for my final.

I wrote a paper on the Miguel Cabrera/Mike Trout MVP debate and the statistics that drove the argument, in addition to giving my professor a walkthrough on statistics we use in baseball on a regular basis that are inherently flawed. At the end of my paper, I listed statistics that I use on a regular basis that I still believe to this day are good indicators of player performance that stay close to equal amongst all players.

To my knowledge, I have not shown anyone the final essay in its entirety: exceptions being my professor, Andy Rodriguez, and the Milwaukee Brewers.

I received an “A” on the final, and included this paper in my portfolio to the Brewers that I assume, in part, landed me the job. I will eventually share every part of that portfolio on this blog. I also find it important to revisit my experience and the amount of work and dumb luck it took to land me that internship, as well, but I figure this essay is a great place to start. We all use statistics to determine player value, regardless of sport. I will help walk you through which statistics are the good ones in baseball, and why the we should stop using the flawed ones.

Anything related to my past experiences or projects in baseball will be posted monthly.

You can view the post here. Enjoy.

Statistics in Baseball: The Endless Debate. A Blast From the Past.

Thomas Vacanti

April 4th, 2013

WRT 381: Writing In Sports

Personal Essay

Statistics In Baseball: The Endless Debate

Wednesday, October 3rd 2012 in Kansas City, Missouri. The Detroit Tigers were playing the Kansas City Royals on a crisp autumn evening, two teams headed in different directions. The Tigers, freshly crowned the 2012 American League Central champions, were headed to their second consecutive postseason appearance while the Royals were wrapping up their season. Manager Jim Leyland, whether Miguel Cabrera was about to set a milestone or not, was likely going to pull him from this game. Unexpectedly, after Cabrera had taken his place at third base in the bottom of the fourth inning, Leyland motions Cabrera back to the dugout as utility infielder Ramon Santiago ran from the dugout to take his place. As Cabrera returned back to the dugout, every fan in Kansas City, including Royals fans, was on their feet, giving him a standing ovation.

What did Cabrera do to deserve such an ovation in hostile territory? He had just accomplished what no hitter has done since 1967, 45 years prior, when Carl Yastrzemski accomplished the feat for the Boston Red Sox: he had just completed a season where he won the Triple Crown. The Triple Crown club is one of the most exclusive clubs in all of professional sports, and a player wins the Triple Crown when he leads his league (American League or National League) in three categories: batting average, home runs, and runs batted in (RBI). It is such a rare feat, that only twelve Major League Baseball (MLB) players have ever completed it in the modern era, and it has only happened once since the 1960s. For comparison, twenty-three pitchers have thrown a perfect game in MLB history. One can assume, because the Triple Crown is so rare, because no one had done it in 45 years, and because Cabrera’s numbers helped contribute to Detroit’s postseason push, that Cabrera had to be a lock to be the American League’s Most Valuable Player, right? 

The Triple Crown, as rare and incredible of an accomplishment as it is, surprisingly was not enough to automatically crown Miguel Cabrera as the AL’s MVP. Another player, Mike Trout, a center fielder for the Los Angeles Angels, was having a season for the ages himself, and many were engrossed by his sensational performance. When his season was over, at age 21 (he was 20 prior to August 7th), he had accomplished something no one had ever done in the history of MLB. Mike Trout, according to baseball-reference.com, finished his 2012 campaign with an impressive batting average of .326, second only to Miguel Cabrera’s .330, he also led the league with 49 stolen bases, and scored 129 runs, two statistics that Cabrera could not even come close to. 

Trout also played pristine defense, winning a Fielding Bible award for being one of the best defensive players in the game of baseball. On many nights, Trout drew “ooh’s” and “ahh’s” from fans as he made superhuman catches. The most documented was on a sunny Baltimore afternoon, June 27th 2012, when the Angels were playing the Baltimore Orioles. Orioles shortstop J.J. Hardy crushes an 82 mile-per-hour curveball thrown by Jered Weaver. The ball was certain to go over the center field wall, but Mike Trout took a leap of faith, jumping what looked to be three feet in the air, snatching the ball out of midair as it was leaving the ballpark, and bringing it back into play as he crashed into the wall. Many pundits called this play “the catch of the year”, and Trout mania had begun.

Miguel Cabrera, on the other hand, did not have the same defensive credentials. A third basemen during the 2012 season, he had spent much of the past four years as a first baseman, a position that is generally acknowledged as a position that requires less defensive skill than most positions, and he was considered a below-average defender at first base. During the 2012 season, questions surrounded whether or not Cabrera could play third, and he held his own, but he was anything but stellar, he was not even an average defender at third base, according to traditional and modern statistics. 

Late in the 2012 season, leading all the way up to the release of the final polling in November, baseball writers, broadcasters, and fans alike began debating which of the two was the league’s Most Valuable Player. The arguments became heated and almost barbaric, with writers calling out other writers for believing a certain player was more valuable than the other. Those who saw Cabrera as the MVP pointed to his Triple Crown, the rarest of all offensive feats, and the fact that without him, the Detroit Tigers would not be heading to the playoffs in 2012. Those who favored Trout felt that Cabrera’s Triple Crown and Detroit’s playoff berth did not outweigh Trout’s overall performance. They argued that Trout excelled in every facet of the game, while Cabrera excelled only offensively. 

Trout supporters also considered traditional baseball statistics barbaric compared to modern day statistics, which, in their minds, should have convinced the baseball world that Trout was far and away the better player in 2012. Many pointed to the sabermetric Wins Above Replacement (WAR), as a tell-all that Trout was more valuable. WAR is a statistic that, in theory, takes every statistic, offensively, and defensively, and combines those many numbers into one number which shows how many wins above a replacement level player in the minor leagues a specific player was worth. If a player has a WAR above 0, they are more valuable than the average replacement level player, and anything below implies that a specific player could be replaced by a minor leaguer and their team would be better off. Trout led all Major Leaguers in 2012 with a staggeringly high 10.9 WAR, meaning he was worth nearly 11 wins more to his team than the average player. Cabrera, on the other hand, finished a distant fourth with a 7.3 WAR, so pundits argued that Cabrera was far and away an inferior player to Trout, and Trout was more valuable.

On the final day of the season, the Baseball Writers Association of America voted for their AL MVP, and in November Cabrera received 22 of 28 possible first place votes to claim the MVP in a surprising landslide. The debates running rampant through the MLB sportswriting world all but pointed to a tight vote and a Trout victory, but somehow, through all the white noise writers and broadcasters alike were generating, Cabrera had the voters’ support all along. But if Cabrera was only better by traditional offensive statistics, and Trout was widely regarded as the better player, why was Cabrera regarded as more valuable

This essay will try to make sense of the unthinkable. Baseball, and sports in general, are markets that are widely numbers-based, which is why those who follow them are so engrossed by statistics. However, is society putting too much stock into the wrong statistics? This writer believes so, and thinks that MLB, and its following, are seeing the game the wrong way. The hope is that those who read this will have a clearer understanding of what value truly is in baseball, and that someday, traditionalists and modernists alike, can agree that a set group of statistics that define a players’ value better than any other. 

Statistics play an integral role in not only baseball, but sports, and those who watch them in general. Statistics provide something concrete that tells anyone who cares “this is the kind of player so-and-so is.” Sure, one can see that, say, shortstop Jose Reyes is one of the most explosive, dynamic, and exciting players in all of professional baseball, but he never would have received a $100 million contract without statistics that back up the aforementioned statement. Good statistics bring money, and theoretically, wins to a particular team, but casual fans, diehard fans, and experts alike all seem to have differing views on which statistics are most important in determining player value, especially in the game of baseball. 

Statistics may play an important role in other sports, but in baseball, they hold a critical importance to understanding the game and the value a particular player or team holds. Consider the following: a quarterback who throws for over 5,000 passing yards in the NFL is likely widely considered a pristine player, but a first baseman in the Major Leagues who hits for a .300 batting average does not necessarily tell the whole story about the player. That first baseman could have an on-base percentage of .315, which means despite his impressive batting average, he struggles to get on base other than through base hits, which could mean he lacks plate discipline. There are plenty of reasons why a player could have a .315 on-base percentage and a .300 batting average, but the point is this: in baseball, one statistic rarely tells the entire story.

Different statistics in baseball can infer what different things a player is and is not capable of doing on the baseball field. Want to gauge how powerful a player’s swing is? Home runs, slugging percentage, and isolated slugging tell a pretty good story of a player’s power. Wonder how efficient a pitcher is? WHIP (Walks and hits per innings pitched) and FIP (Fielding Independent Pitching) can show how efficient a player is either in a game or throughout an entire season. These statistics are merely the starting point for determining a player’s value. It is known that MLB publishes 85 different individual player statistics, and these statistics do not include sabermetrics, of which accumulate to hundreds of possible ways to evaluate a player.

So how do fans, broadcasters, talent evaluators, and front office executives alike make sense of all the madness? With so many statistics out there, which ones matter, and which ones not so much? There are many statistics that say something about a player, but not many that say everything about a player, and there are a few statistics, in the opinions of many, that say absolutely nothing about a player. In the definition of nothing, it is meant because what that statistic says, does not actually contribute to what that player is worth. For example, the pickoff statistic for pitchers really does not say a whole lot about how good or bad a particular pitcher is. If a pitcher picks off more runners than any other pitcher in baseball, is he better than every other pitcher in baseball? At picking off runners, maybe, but that statistic says absolutely nothing about the value of the pitcher, because, sure, he can catch a baserunner off-guard and throw him out, but suppose he also gives up a lot of runs as well. Does his ability to pick off runners outweigh his weakness of allowing those he does not pick off to score? Absolutely not. 

So if there are statistics that say something, and statistics that say nothing, are there any statistics out there that say everything about a player? There are sabermetrics, modern-day statistics, that try to do just, but unfortunately, few, say anything all too helpful that traditional statistics cannot. Jump back a few pages, and consider the WAR statistic again. As previously explained, is a statistic that tries to bring all of a baseball player’s numbers down to one number: how many wins above a replacement-level player a particular player is. In theory, this sounds like a great way to say exactly how a player might stack up against all the others in baseball, but there is a huge problem with WAR that makes it a statistic that is so inconsistent it is as unreliable as it is near impractical. The biggest problem with WAR, is that if one is researching a particular player, they will likely see a different number depending on where they are researching the player. 

Let’s say, for the sake of argument, this player is Howie Kendrick, a second baseman for the Los Angeles Angels, in 2011. On FanGraphs, one will see that Howie Kendrick has a WAR of 5.8, which was the highest among Angels’ position players that year. 5.8 would also be widely considered a high WAR, particularly for a second baseman, a position that rarely produces elite value. A 5.8 WAR would make Kendrick one of the best second baseman in the game. If, however, instead of FanGraphs, one looked up Kendrick’s WAR on Baseball Prospectus, one would see his WAR is 2.7, an above-average player, but nothing elite, not like FanGraphs was implying. There is also another site, baseball-reference.com, that also calculates its own version of WAR. 

Each version of WAR incorporates different statistics into its formula and calculates it differently than the other two, because of plenty of differing opinion on the importance of statistics. It is quite ironic, really, a statistic that is supposed to be an all-encompassing statistic, but is calculated differently by different people because they feel some statistics are more important than others. Can we, based on the above information, truly trust WAR to gauge the value of a player? Until pundits can agree on one formula and one version of WAR applicable and agreeable by the sabermetrics experts, it is difficult to say that any kind of WAR statistic is a reliable source to find value in a player. It is like comparing apples to oranges, you just will not find any kind of specific agreement between them.

Another statistic that baseball “experts”, writers, fans, and even MLB itself uses constantly but is a statistic that is horrible for gauging player value is OPS, or on-base-plus-slugging percentage. This statistic combines two statistics: on-base percentage and slugging percentage, to show how good a hitter is at combining two integral skills, getting on base and hitting with power. Again, in theory, this seems like a good statistic for seeing how players stack up against each other, but this statistic is fatally flawed. Keith Law of ESPN (2013) said it best: 

“OPS, the fauxbermetric stat that results from a straight addition of the two, ignores the difference in value between the two — a point of extra OBP is worth a lot more to a team’s run-scoring potential than a point of slugging.

Consider two players with an .800 OPS: One has a .350 OBP and a .450 slugging, and one has a .400 OBP and a .400 slugging. The second player is clearly more valuable: He makes fewer outs than the first player, and the number of additional times he’s on base exceeds the number of extra bases added by the first player.” (Law, 2013)

So, in short, two players with the same OPS are not necessarily equal players. The straight addition of both on-base percentage and slugging percentage is creating a fallacy that both of these statistics are equal, but on-base percentage is far more important when it comes to creating runs. How can we be expected to rely on this statistic if what is supposed to be equal is not equal? It is apparent that OPS is a flawed statistic that cannot be used to truly evaluate a player.

Obviously, there is a recurring theme in sabermetrics: two numbers that are equal in one statistic are not necessarily equal in determining player value. Essentially, what I feel is that to truly determine player value, one has to consider statistics that are equal for all players. No gimmicks, no underlying statistics that have to be taken with a grain of salt, no alternative ways to calculate the statistic, just pure equality. Maybe, if we cannot find such equality in regularly used sabermetrics, we can find equality in traditional statistics?

Sadly, the answer to this question is no. Consider the traditional statistic batting average, which is the division of hits by the number of at-bats a player had in a set duration of time. For example, if a player had 200 hits in 600 at-bats, his batting average would be .333. For any player, this is an excellent batting average, but does batting average determine how good a particular player is? The inclination is to say yes, but batting average, like so many other statistics, do not tell the whole story. A player who hits .333 might be a good hitter, or he may be completely lucky. Consider two players who hit .333, but both players have different BABIPs (batting average on balls in play). Batting average on balls in play is the likelihood that a player will receive a hit on a ball he put in play. The higher a player’s BABIP, the luckier a player is said to be, because not every ball that is hit into play results in a hit. So, a player with a .333 average, but a .350 BABIP, is likely a better hitter than the player who hits .333 but has a .410 BABIP, because he does more with fewer opportunities, while the other hitter merely has to put the ball in play to get hits.

Additionally, those two same hitters likely do not have the same amount of at-bats in the same season. Putting at-bats, batting average, and BABIP together tells a different story entirely. If the first player, with a batting average/BABIP of .333/.350 also had 600 at-bats, you know that player was not all that lucky, but the player with the .333/.410 slash line with only 100 at-bats, you can infer that this player has been going through a hot streak, and is a likely beneficiary of luck. So even traditional statistics have major flaws that go along with them.

If sabermetrics are not the answer, and traditional statistics are not the answer, where can we find value? Where can we find equality? Where, in all the inconsistencies and ambiguities, is there a proper means of evaluating a baseball player? Well, there have been clues hidden throughout this entire essay to help reveal part of the answer: there is no one statistic. It requires the assistance of other statistics to help solidify any case of evaluation. There are various statistics, however, that when used correctly, effectively determine the value of a player, and this writer believes that these are the most important statistics in today’s day and age. They are flawed, just like every other statistic out there in some way, shape, or form, but they provide a clearer idea of how valuable a particular player at the basic level than any other.

Batting Average on Balls In Play

Over any period of time, BABIP is a very helpful statistic. To review, a player with a higher BABIP is likely luckier than a player with a lower BABIP. If a player has a good offensive season out of the blue, look at his BABIP, if it is a lot higher than his career norm and the league average, heed caution when picking him up in a fantasy draft, or hold off on optimism when your MLB team signs him. The flaw with this statistic is that players who are speedier than others may benefit from an extra infield single or two which would inflate their BABIP, but it still is a good indicator of the amount of luck that has contributed to a player’s offensive value.

Miguel Cabrera: .331 (Batting average .330), Mike Trout: .383 (Batting average .326)

On Base Percentage

On base percentage by itself is a fantastic way to gauge how productive a player is with his at-bats. Players with higher OBPs are a tougher out than those with lower, and generally are more productive than those with lower OBPs. Is there any ambiguity that a player that gets on base more often than someone else is more valuable? In the game of baseball, I would think that there is only clarity in that statement.

Miguel Cabrera: .393, Mike Trout: .399

Slugging Percentage

Slugging percentage by itself is a way to determine not how many hits a player has, but what a player does with those hits. The higher one’s slugging percentage, the more powerful and more productive the hit. If a General Manager or a fantasy baseball player is looking for a powerful hitter, a player who slugs well is a pretty sure bet. Slugging percentage is slightly flawed because it puts an equal importance on each base when totaling them, but it is an excellent starting point in determining the productivity of a player’s base hits.

Miguel Cabrera: .606, Mike Trout: .564

Those three offensive statistics, for me, are the big three that do a very good job of determining how good a hitter truly is. I threw in the numbers that Cabrera and Trout had during the 2012 season for each of those statistics, and, no contest, Miguel Cabrera was the more valuable offensive player. These statistics show that Mike Trout, offensively, although he may have stolen more bases and scored more runs, was also luckier than Cabrera in terms of getting hits, got on base just a little bit more, and slugged a whole lot less. Cabrera, on the other hand, fought for his base hits due to his low BABIP, but maintained a high batting average. He also slugged a whole lot better, and got on base at a similar clip as Trout. There is no question the more valuable player offensively was Cabrera, based on these near all-encompassing statistics, without even including the facts that Cabrera had won the Triple Crown and slugged his team into the postseason, while Trout’s Angels did not make the playoffs in 2012.

Strikeouts/Walk Percentage

The hitter has three statistics that can display a hitter’s true value, but what about pitchers? Pitchers also have three statistics that represent a pitcher’s value well. The first is strikeouts and walk percentage. There are a lot of things that happen in baseball that a pitcher cannot control. Home runs, errors, terrible defense, different size ballparks, the list goes on, but a pitcher is not a Major League pitcher based on luck alone, because it is rarely the luckiest who pitch the best in professional baseball, but usually the most talented. There are two indisputable things a pitcher is capable of controlling: how many batters a pitcher strikes out, and how many walks a pitcher allows. If a pitcher does not walk many but strikes out plenty, he is a better bet to be a consistently good pitcher than his counterpart who does the opposite. If this is the case, why not use strikeouts and walks per nine innings as opposed to a percentage? Keith Law (2013), in the same piece above about baseball statistics, opines “It’s more instructive to use strikeout and walk percentage — as opposed to strikeouts and walks per nine innings — because some pitchers face more batters per inning than other pitchers, which means they get more chances to strike out or walk them” (Law, 2013). Makes sense.

Fielding Independent Pitching

To best explain what FIP is, I investigated the definitions that each FanGraphs, Baseball Prospectus, and Baseball-Reference had, and they, to the likely surprise and dismay of my readers, have the same formula and definition. FanGraphs (2013) describes it best as such:

Fielding Independent Pitching (FIP) measures what a player’s ERA [earned run average, number of earned runs allowed divided by innings pitched] should have looked like over a given time period, assuming that performance on balls in play and timing were league average. Back in the early 2000s, research by Voros McCracken revealed that the amount of balls that fall in for hits against pitchers do not correlate well across seasons. In other words, pitchers have little control over balls in play. McCracken outlined a better way to assess a pitcher’s talent level by looking at results a pitcher can control: strikeouts, walks, hit by pitches, and homeruns.

A walk is not as harmful as a homerun and a strikeout has less impact than both. FIP accounts for these kinds of differences, presenting the results on the same scale as ERA. It has been shown to be more effective than ERA in terms of predicting future performance and has become a mainstay in sabermetric analysis (FanGraphs, 2013).

If a pitcher has a high ERA, take a look at his FIP, if it is lower than his ERA, he likely was a victim of some bad luck, or some factors that he could not control. Baseball’s best pitchers have some of the games’ best FIP numbers, but pitchers with high ERAs but lower FIPs can be pointed to as guys destined to bounce back.

BABIP 

BABIP is as useful a tool for pitchers as it is for hitters. If one applies what they know from BABIP and reverses the application of it, then it can be used to determine how lucky or unlucky a pitcher is. A pitcher with a low BABIP is likely more lucky than someone with a high BABIP, and anyone with an extreme either way should require some skepticism before declaring that particular pitcher “good” or “bad”.  

So, to conclude, numbers and statistics are an important part of baseball. The right statistics allow the right evaluation of a player. Oftentimes, we tend to overlook the numbers that truly matter, and tend to go with the norms, what people generally regard as accepted. It is time we start looking at the numbers that truly matter, regardless of the status quo. It is time to start asking the right questions, as opposed to wondering silently why something is the way it is. Baseball will someday likely have a set of statistics that everyone involved or relatively interested in the sport will agree upon, but for now, the debate runs rampant. As baseball changes, there will always be a new mean of evaluation, but it is this writer’s hope, through all of the controversy and disagreement, we will find some way to make sense of things, and come to together in agreement. Until that day comes, well, I am anxiously awaiting the first rebuttal to my argument.

“A lot of players told me I’m going to be the MVP, I said, ‘I bet you’re saying the same thing to Trout.’ I always tell them to give credit to Trout. He’s the first rookie to do what he did. He’s great for baseball.” -Miguel Cabrera on his MVP Award, and rookie phenom Mike Trout.

Work’s Cited

2012 Major League Baseball Batting Leaders (2012, October). In baseball-reference.com. Retrieved April 4, 2013, from  HYPERLINK “http://www.baseball-reference.com/leagues/MLB/2012-batting-leaders.shtml” http://www.baseball-reference.com/leagues/MLB/2012-batting-leaders.shtml

(2012). Must C: Catch [Online video]. MLB.com. Retrieved April 4, 2013, from  HYPERLINK “http://mlb.mlb.com/video/play.jsp?content_id=22644539&c_id=mlb&topic_id=vtp_must_c” http://mlb.mlb.com/video/play.jsp?content_id=22644539&c_id=mlb&topic_id=vtp_must_c

DuPaul, G. (2012, June 16). Be Wary of WAR: A Cautionary Tale. In Yahoo Sports. Retrieved April 20, 2013, from  HYPERLINK “http://www.beyondtheboxscore.com/2012/6/16/3085251/be-wary-of-war-a-cautionary-tale” http://www.beyondtheboxscore.com/2012/6/16/3085251/be-wary-of-war-a-cautionary-tale

FIP (2013). In FanGraphs.com. Retrieved April 25, 2013, from  HYPERLINK “http://www.fangraphs.com/library/pitching/fip/” http://www.fangraphs.com/library/pitching/fip/

Law, K. (2013, February 19). The Stats I Can’t Live Without. In ESPN.com. Retrieved April 10, 2013, from http://insider.espn.go.com/mlb/blog/_/name/law_keith/id/8961789/obp-babip-most-important-baseball-statistics-needed-player-evaluation-mlb 

 Statistics courtesy of baseball-reference.com

 Taken from the highlight video, “Trout’s Remarkable Grab”, June 28th, 2012 LAA vs. BAL

 WAR is baseball-reference’s version of WAR, used by ESPN.com

 Courtesy of the BWAA’s website

 Divided by hitting, pitching, and fielding

 Some information is used from a Yahoo Sports Article: “Be Wary of WAR: A Cautionary Tale”

 All Miguel Cabrera/Mike Trout statistics are taken from FanGraphs

 PAGE 1

 PAGE 1

Thomas Vacanti  DATE \@ “MMM d, ”yy, h:mm AM/PM” Aug 15, ’13, 8:51 PM

Collusion or Common Sense? The Death of the MLB 10-Year Contract.

I do feel badly for Bryce Harper and Manny Machado.

They, like Mike Trout, are both once-in-a-generation talent. It isn’t just rare for a player to get called up to the major leagues at age 19 and stick for six (in their case: seven – I can get into that later) straight years to become free agents at the very young age of 26, it’s unheard of.

For it to happen to two players in the same offseason is historic. The last time a player age 26 or younger hit free agency was the year 2000, when a 25-year-old Alex Rodriguez signed the largest free agent deal in history: a 10-year, $252 million deal with the Texas Rangers.

Nineteen years later, pitchers and catchers have already reported for Spring Training, but neither Machado nor Harper have signed a contract with any team. Why? They are both holding out for a larger contract than the one Rodriguez signed: 10+ years, and well over $300 million.

As I’ve mentioned in previous posts – this is not new. This has been happening with regularity the last three offseasons. Teams wait until the last possible minute to sign top free agents, and players are beginning to notice. Former Detroit Tiger Justin Verlander tweeted his own hot take on the situation on Tuesday, and other players and the Player’s Union are whispering, not so loudly, that the owners are intentionally holding out, reluctant to sign players to big money. They avoid the “c” word, but they certainly imply that owners are colluding to bring asking prices down and sign players to shorter, cheaper, more team-friendly deals.

But are we seeing collusion? Or, alternatively, are we seeing something completely different?

As much as I’d like another job in a MLB front office somewhere, I am not saying this to pander to potential employers: I think this is a new wave of business in baseball, and it’s the right call. The reason I say this? Ultimately, 10-year contracts in baseball have largely been irresponsible and costly for the team signing them. Let’s take a look:

10-Year Contracts: A Case Study

There have been only a handful of 10+ year contracts handed out throughout baseball through history. They are as follows:

  1. RHP Wayne Garland; Cleveland Indians 1977 (10 years; $2.3 million)
  2. OF Richie Zisk; Texas Rangers 1978 (10 years; $3 million)
  3. OF Dave Winfield; New York Yankees 1981 (10 years; $23 million)
  4. SS Alex Rodriguez; Texas Rangers 2000 (10 years; $252 million)
  5. SS Derek Jeter; New York Yankees 2000 (10 years; $189 million)
  6. 3B Alex Rodriguez; New York Yankees 2007 (10 years; $275 million after exercising his opt-out clause following the 2007 season)
  7. SS Troy Tulowitzki; Colorado Rockies 2010 (6-year extension, bringing the commitment to 10 years; $157.75 million)
  8. OF Ryan Braun; Milwaukee Brewers 2011 (10 years: $145.5 million)
  9. 1B Albert Pujols; Los Angeles Angels 2012 (10 years; $254 million)
  10. 1B Joey Votto; Cincinnati Reds 2012 (12 years; $251.5 million)
  11. 2B Robinson Cano; Seattle Mariners 2013 (10 years; $240 million)

Ignore the seemingly paltry salaries that Garland, Zisk, and Winfield signed in the late 70’s-early 80’s. Free agency was either just being implemented or in its infancy, and player salaries were much much lower back then. Even still, we can still look at their overall numbers and determine whether or not their contracts were successful or not (spoiler alert: they overwhelmingly were not).

Any contract a baseball player signs contains guaranteed money, meaning regardless of what happens (injury, performance, etc.), the team that signs said player is on the hook for the remaining years and money on that deal unless one of three things happen: 1.) the player retires, thus forgoing any remaining salary left on the contract, 2.) the player is suspended by Major League Baseball, or 3.) the player is traded to another team, in which case the receiving team is required to pay said player the remaining years and salary of the contract – unless, of course, they are subject to either scenario 1 or 2 at any given time.

When a player signs a long-term contract, regardless of how bad things get, a player almost never retires and gives up their remaining salary. Case in point: Prince Fielder signed a 9-year $214 million contract with the Detroit Tigers in 2012. The Tigers traded Fielder to the Texas Rangers during the 2013-2014 offseason for Ian Kinsler and $24 million: payable in $6 million installments from 2016-2020, when his contract is up.

What happened? In August of 2016, not two years into his stint with the Rangers, Fielder held a press conference, announcing that doctor’s have told him he is medically unable to play baseball. Therefore, he will no longer be able to play.

Did he retire? Nope! He phrased it very carefully: he is “medically unable to play baseball.” The Rangers still owe him from 2016-2020, and so do the Tigers, in the form of $6 million this year and next, just like they have the last two years. You can’t blame him, that’s a lot of money to leave on the table, but it’s also a lot of money two teams are playing one player to be sitting somewhere other than in their dugout.

Anyway, I have done some research to determine whether or not each of these 10+ year deals were good baseball decisions by the teams who made them. Many of them ended badly:

Wayne Garland, after signing his deal, only lasted 5 years before the Cleveland Indians cut him loose. In the five years he pitched, he generated a negative bWAR (wins above replacement) of -0.8. I have explained WAR previously, but essentially in any given year, a WAR over 0 means a player has more value than a replacement level player in the minors. Over the course of 5 years, Garland was worse than a minor league pitcher over that span.

In addition, Garland allowed more earned runs than hitters he struck out from 77-81. Yikes.

Richie Zisk fared a little better. He was able to leverage a 2.7 WAR (about Major League average by today’s standards) season in 1977 into a monster contract at the time. Zisk never replicated that season again, or came anywhere close. He was traded three years into his deal with the Rangers to Seattle, and retired three years after that. He never completed the 10 year deal.

Dave Winfield’s contract was mostly successful. He was good for a .275 batting average, 20+ homers, 100 RBI’s, and a great outfield defense every year prior to signing and for much of the life of his contract. He remained relatively steady throughout the life of his contract. I’m sure his only regret was a poor showing in the 1981 postseason, surprisingly their only appearance with Winfield in pinstripes. He was eventually inducted into the Hall of Fame in 2001, deservingly so.

It’s hard to call Alex Rodriguez’s first 10-year contract for the Rangers successful, when he was traded three years into his deal to the New York Yankees. Though through the life of that contract, A-Rod put up phenomenal numbers, which were acknowledged by three MVP awards over the course of the deal, and opted out of that deal after year 7 to sign another 10 year deal. His second 10-year deal, however, was mired by injury, scandal, and suspensions. He walked away from his second deal with a World Series ring in 2009, and a hell of a lot of money, but not much else. He sharply regressed over the second 10 years.

Derek Jeter’s 10-year deal was probably the most successful 10-year contract of the bunch so far, if only because he spent all of it with the New York Yankees and played really solid baseball while doing it. He will be a first-ballot Hall Of Famer next year.

Troy Tulowitzki was already injury-prone prior to be traded to the Toronto Blue Jays in 2015, and continued the life of that contract to prove to be the injury-prone player he always was. When he was on the field, he was a shell of what he used to be. He signed a Major League contract with the Yankees this offseason. How much of his career he is able to salvage remains to be seen.

Ryan Braun, not without scandal, has withstood the life of his contract entirely in one uniform in Milwaukee. He has been a useful player when healthy, but rarely worth the $20 million annually he has been paid. His salary will decrease over the rest of the life of his deal until 2021 when he has to decide whether or not to pick up his $15 million mutual option. In that case, of course, the Brewers also have to agree to pick up his option. If he continues to put up the numbers he did in 2018, they will assuredly buy him out at $4 million.

Albert Pujols is one of the greatest hitters of this generation, no question. In his time in St. Louis, his lowest WAR output was 5.3 in the last year of his contract, and certainly an elite player starting to exit his prime years of his career. The Los Angeles Angels gambled and decided to give him a 10-year contract at age 32, and the results have been horrible: his last three years in LA he has rewarded them with WAR’s of 1.3, -1.8, and 0.5. He’s still owed three more seasons at hefty prices of $28 million, $29 million, and $30 million. He’s a no-doubt Hall of Famer, but not worth what he’s paid. Not even close.

Joey Votto has been consistently great, year after year, in Cincinnati. Even in a 12-homer year last year, his .417 OBP led the league. He’s been worth every penny of his contract so far, but he’ll be 35 in 2019, with 5 more years on his contract. A lot remains to be seen with Votto.

Robinson Cano was recently hit with a suspension for Performance Enhancing Drug use, but contributed 23.7 WAR in his first five years of his contract. A great output. Then, this offseason, was shipped to the New York Mets to finish out the rest of his contract. Still a lot that remains to be seen with him, but not in a Mariners uniform.

Breaking It All Down

Of the 11 players who have ever signed a 10-year+ deal, only 7 have had the chance to see their contracts through. Two of them retired early, two were mired with injury, scandal, or both, two were probably worth it, and the other would have probably been worth it, but he was traded in the middle of the contract. The rest are in the middle of their contracts, but one has been a disaster, one hasn’t been a disaster, but not worth the money, one has been traded in the midst of the deal, and the other has probably been worth it so far.

Taking trades out of the equation, only three of these contracts have been what I consider successful: Derek Jeter, Dave Winfield, and Joey Votto. The rest have been some degree of regrettable. A success rate of less than 30%. It’s no wonder Bryce Harper and Manny Machado are still sitting at home. Teams are more wary than ever to sign a player to a commitment that large.

I also mentioned back in my first post that teams now have access to the same player information through analytics, and are all looking at players the same way. Their philosophies may differ slightly, and so might their approach, but they all have the same information to work with. That information leads to one inevitable conclusion: 10-year contracts are a HUGE gamble, and more often than not, not worth the risk.

That said, Bryce and Manny both very well might sign 10-year contracts before this is all said and done. They also might be worth it. Time will tell.

MLB Expansion: What Does It Look Like? Part 1 (of 3): Identifying the Cities

Four weeks ago, I evaluated the current state of Major League Baseball, and mentioned that one of the ways to curb a non-competitive environment in the game would be to expand the postseason. The most feasible way to do that involves MLB expanding: adding two teams to bring their total to 32 teams.

Expansion to 32 allows for all sorts of intriguing possibilities: shortening the regular season (we’ll revisit this in part 2), expanding the postseason, and, most importantly, dividing the divisions up into more geographically convenient entities (improving travel) and decreasing the number of teams in each division from 5 to 4. Three divisions of five teams in each league is an odd way to divide the league. It’s antiquated, it’s confusing, and it allows nearly two thirds of the league to get away with tanking. Four divisions with four teams each makes the playing field far more competitive.

To do this, the National League also has to implement the DH, getting rid of the pitcher taking a place in the lineup. I understand traditionalists’ desire to keep the tradition of pitcher’s hitting in the lineup, but adding the DH makes economic sense for two big reasons: 1.) It creates jobs for 15 (or for the sake of expansion 16) additional DH’s, prolonging the careers of some of our favorite players, and 2.) fans appreciate offense. I understand the enjoyment of a pitcher coming through with a big hit, but those moments are few and far between. Even the worst hitters in the game today can outperform a pitcher over 600 plate appearances.

For the sake of this piece, I am moving forward with two assumptions: 1.) that the Oakland Athletics resolve their stadium issues with their proposed new stadium, and 2.) the Tampa Bay Rays, who’s stadium issues have hit a snag, are relocated. In this case, I am going to take one of the potential cities for expansion off the table and put them in Charlotte, North Carolina, making them (for now) the Charlotte Rays.

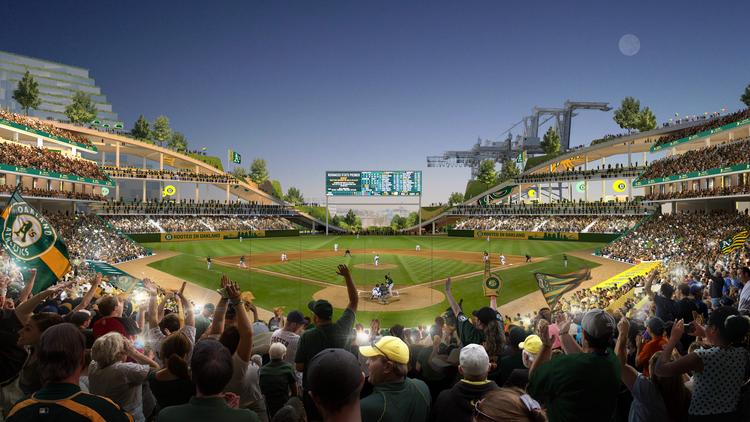
A rendering of the new ballpark to be built in Oakland, California.

Why Charlotte?

Let me start with the obvious: relocating the Rays to Charlotte eliminates the potential problem of having to realign the divisions in a 30-team scenario. It still puts the Rays in the American League East, and in fact, makes them geographically closer to their AL East counterparts in the Baltimore Orioles, New York Yankees, Boston Red Sox, and the Toronto Blue Jays.

The view from Charlotte’s current minor league ballpark.

In addition, there are other reasons that make Charlotte the prime destination for a relocated team: 1.) they have led the minor leagues in overall attendance two of the last three years. 2.) they already have a wildly successful major league franchise based in Charlotte in the National Football League’s Carolina Panthers, and they have a National Basketball Association presence in the Charlotte Hornets. 3.) It has the 23rd largest media market in the country, ahead of six current MLB teams. Finally, 4.) North Carolina is a state already deeply engrained in baseball culture with Team USA’s headquarters in Durham, NC, strong collegiate programs in UNC and NC State, and a myriad of minor league franchises peppered throughout the state. MLB in Charlotte just makes sense.

Where to Next?

All told, there are several other destinations to house two more MLB teams. By media market size throughout North America, they are as follows:

  1. Mexico City, Mexico
  2. Montreal, QC
  3. Tampa-St. Petersburg, FL*
  4. Orlando, FL*
  5. Calgary, AB
  6. Raleigh-Durham, NC*
  7. Sacramento, CA*
  8. Portland, OR
  9. Vancouver, BC
  10. San Juan, PR
  11. Nashville, TN
  12. Indianapolis, IN
  13. Salt Lake City, UT
  14. San Antonio, TX*
  15. Hartford-New Haven, CT*
  16. Columbus, OH*
  17. West Palm Beach, FL*
  18. Greenville, SC
  19. Las Vegas, NV
  20. Austin, TX*

Already, quite a list. I haven’t even gotten to Jacksonville, FL, New Orleans, LA, Green Bay, WI, or Memphis, TN. All cities that house at least one major league sport franchise.

Notice a lot of asterisks? Well, the reason that they’re there is pretty simple, but I’ll get into that more in a second by first explaining the situation with Tampa. Tampa just lost their team, and acting in good faith as the de facto MLB Commissioner I am assuming that they will not be in consideration for expansion. If they did not want to ante up the taxpayer dollars for a new stadium for the Rays, then no right-minded investor is going to want to go near that market to put up an exorbitant expansion fee upwards of $1 billion, in addition to building a privately-funded brand new stadium in the Tampa Bay area. It isn’t going to happen anymore.

The rest of the media markets on this list are in what is considered “anti-trust” territory. Back in the 20’s, the United States Supreme Court set a legal precedent for MLB, making them one of the few entities in the entire country with an antitrust exemption. To spare you the legal jargon: they are legally a monopoly that can flex their muscle on any region they have already laid a claim for both their Major League and Minor League affiliates. The asterisked markets represent a direct competition with a Major League market. Orlando, FL would absolutely be in the Miami Marlins’ territory, Raleigh-Durham would interfere with what Charlotte is trying to do, Sacramento would have to pry themselves loose of San Francisco and Oakland’s grasp, and San Antonio, Hartford, Columbus, West Palm Beach, and Austin would all have the likes of the Astros/Rangers, Yankees, Indians/Reds, Marlins, and Astros/Rangers to deal with, respectively. Too many hoops to jump through, so let’s call them a wash.

Mexico City, Montreal, Calgary, Portland, Vancouver, San Juan, Nashville, Indianapolis, Salt Lake City, Greenville, and Las Vegas remain.

Eliminating The Rest

Let’s get a few of these cities out of the way so we can pave our way toward expansion.

Mexico City is a huge market, but if we’re being honest, there are too many issues with the market to call it a safe bet. It is consistently hotter there than any US city, excluding Phoenix, AZ and Las Vegas, NV, so a retractable-roof, AC powered stadium would be necessary in that market. Plus, it is at an extremely high elevation, which means the air is less dense and the baseball will travel more freely there. It would be a hitter’s paradise. Neither of these are the main issue to eliminate Mexico as an expansion team. Travel issues would be sure to be the hurdle that eliminates Mexico from the list. Additionally, soccer is Mexico’s behemoth sport, and baseball would need to be a sure thing to turn a profit, and I don’t think there’s enough evidence there to suggest baseball would be immensely successful there. Take Mexico City off the list.

Montreal has had a MLB team in the past: the Montreal Expos. However, they were always a small-market team that struggled to draw a crowd, and their old stadium is in desperate need of renovation or replacement. There is evidence to suggest that baseball could make a comeback in Quebec (an enthusiastic mayor and sellout exhibition games make me wonder), but it doesn’t make my final cut.

Calgary has a large enough media market, and the CFL has probably their most successful team housed in Calgary in the Stampeders, but baseball in an unestablished market is forcing me to eliminate them from contention. Vancouver is in the same boat, coupled with the fact that it’s too close to the Seattle Mariners for comfort, I imagine.

San Juan is still recovering from Hurricane Maria. Baseball is a part of the lifeblood of the US territory, but without statehood, I don’t think it has the funds or the development to successfully house a MLB franchise. Scratch San Juan from contention. Grant them statehood and give them the funds to develop as any US state would, and I think we can have a different conversation.

Indianapolis would be interesting, it has a strong MiLB following (it led all of minor league baseball in attendance in 2017 and regularly fronts strong attendance numbers). However, another team in the Midwest is not what baseball needs. Their media market only consists of the metro area. Go too far south, and you have crossover with the St. Louis Cardinals or the Cincinnati Reds. Go too far north, and you’re encroaching on the rich history of Chicago White Sox and Chicago Cubs fans who are not going to be shifting their allegiance anytime soon. Count them out.

Salt Lake City and Greenville are not large enough markets and are not growing enough to lead me to believe they are viable candidates for expansion.

Ah, Las Vegas. They are already seeing the success story of their expansion team in the National Hockey League in the Vegas Golden Knights (Western Conference Champions in 2017-2018) and will be welcoming the Las Vegas Raiders to the NFL in 2020. But those two sites were already being funded by taxpayer dollars, a retractable-roof, AC powered ballpark would cost their taxpayers an additional $1 billion. I don’t think you will be able to sell Las Vegas proper on this one. Even if you could, I think baseball dies in that desert as the Raiders and the Golden Knights will already be trying to establish their markets and consumer base. Another team muddies the landscape and residents and tourists alike will be torn as to where to go and who to follow. It’s too new of a market to try and expand to.

That leaves Portland, OR, and Nashville, TN, as our two sites for expansion.

Why Portland? Why Nashville?

Let’s start with Portland, they’re the easiest to establish. Portland has been trying to acquire a MLB team for a very very long time. They have been the source of several threats for relocation, and just a few weeks ago they unveiled a plan and a site to build a MLB-ready ballpark in their city. Portland is also loaded with investors ready to jump at the chance of owning a MLB franchise. With no more threats of relocation as the Rays have been moved to Charlotte, MLB has no choice but to grant Portland a bid for expansion. Welcome to the MLB, Portland Beavers.

A rendering of the proposed ballpark to be built in Portland, Oregon.

Nashville is one of the fastest growing cities in the United States. They already have two successful franchises in the Tennessee Titans of the NFL and the Nashville Predators of the NHL, and with MLB teams in just Charlotte and Atlanta, MLB doesn’t really have a stronghold on the south. Nashville already houses a successful collegiate team with a strong following at Vanderbilt, the city itself is a tourist attraction, and the closest competing market is the Atlanta Braves. With investors lined up and ready to pull the trigger on a site adjacent to the Titan’s Nissan Stadium, this one is another no-brainer. Nashville Mountaineers, welcome to the show.

How Does This Set Up Realignment?

This allows for better realignment within the league, geographically, to make travel less of a nightmare. Let’s first start out by laying out our current 30 team league as it stands now:

AL East:

  1. Boston Red Sox
  2. New York Yankees
  3. Toronto Blue Jays
  4. Baltimore Orioles
  5. Tampa Bay Rays

NL East:

  1. New York Mets
  2. Philadelphia Phillies
  3. Washinton Nationals
  4. Atlanta Braves
  5. Miami Marlins

AL Central:

  1. Cleveland Indians
  2. Detroit Tigers
  3. Chicago White Sox
  4. Minnesota Twins
  5. Kansas City Royals

NL Central:

  1. Pittsburgh Pirates
  2. Cincinnati Reds
  3. Chicago Cubs
  4. Milwaukee Brewers
  5. St. Louis Cardinals

AL West:

  1. Houston Astros
  2. Texas Rangers
  3. Los Angeles Angels
  4. Oakland Athletics
  5. Seattle Mariners

NL West:

  1. Colorado Rockies
  2. Arizona Diamondbacks
  3. San Diego Padres
  4. Los Angeles Dodgers
  5. San Francisco Giants

As you can see, there are travel issues littered in this layout. The Seattle Mariners have to travel 2,300 miles to play their division rivals in Houston. The Mets have to travel 1,300 miles to play their division rivals in Miami. This doesn’t make any sense. Add to the fact that only 33.3% of these teams make the playoffs, and it goes from not making any sense to a damn shame.

Throw two more teams into the mix, and things get much easier. I eliminated the AL/NL and am now just calling the divisions for what they are, geographically:

Northeast:

  1. Boston Red Sox
  2. New York Yankees
  3. New York Mets
  4. Philadelphia Phillies

Appalachian:

  1. Baltimore Orioles
  2. Washington Nationals
  3. Pittsburgh Pirates
  4. Cincinnati Reds

Great Lakes:

  1. Toronto Blue Jays
  2. Cleveland Indians
  3. Detroit Tigers
  4. Milwaukee Brewers

Midwest:

  1. Chicago Cubs
  2. Chicago White Sox
  3. Minnesota Twins
  4. St. Louis Cardinals

South:

  1. Charlotte Rays
  2. Nashville Mountaineers
  3. Atlanta Braves
  4. Miami Marlins

Central:

  1. Texas Rangers
  2. Houston Astros
  3. Colorado Rockies
  4. Kansas City Royals

Southwest:

  1. Arizona Diamondbacks
  2. San Diego Padres
  3. Los Angeles Dodgers
  4. Los Angeles Angels

Northwest:

  1. San Francisco Giants
  2. Oakland Athletics
  3. Portland Beavers
  4. Seattle Mariners

No, it’s not perfect, but it still works on a logistical level. It also creates some new rivalries (Oakland/San Francisco, Detroit/Toronto, LA/LA, NY/NY, Portland/Seattle, Yankees/Phillies, and Chicago/Chicago all come to mind). Eight division winners, four wild card participants, and 50% of MLB receives an invitation to the postseason? I can get behind that.

 Part 2 will focus on shortening the regular season schedule, part 3 will reveal how MLB has implemented expansion in the past, and what that means for teams that you care about. Coming soon.

Detroit Tigers: Top 5 Prospects to Watch In 2019

Stating the obvious: since the end of the 2016 season the Detroit Tigers haven’t been all that fun to watch.

At the end of the 2016 regular season, General Manager Al Avila did the right thing and announced that the Tigers would be stripping down their current roster and beginning a full-scale rebuild of the organization from the ground up. This means lackluster baseball and a lot of losses at the Major League level, but there are some interesting pieces starting to take their place in the minor leagues. They have quickly restocked their bottom shelves, so to speak, and have gone from a bottom-five farm system to, arguably, one that belongs in the top-ten discussion.

Does this mean that the Tigers are knocking on the door of being a competitive team again soon? Not a chance. But what it does mean is that there are prospects in their minor league system that could contribute to a team that will eventually compete, and a few could be key players on that team. A few to keep an eye on, while dreaming for better days for the Tigers:

1. Casey Mize, RHP

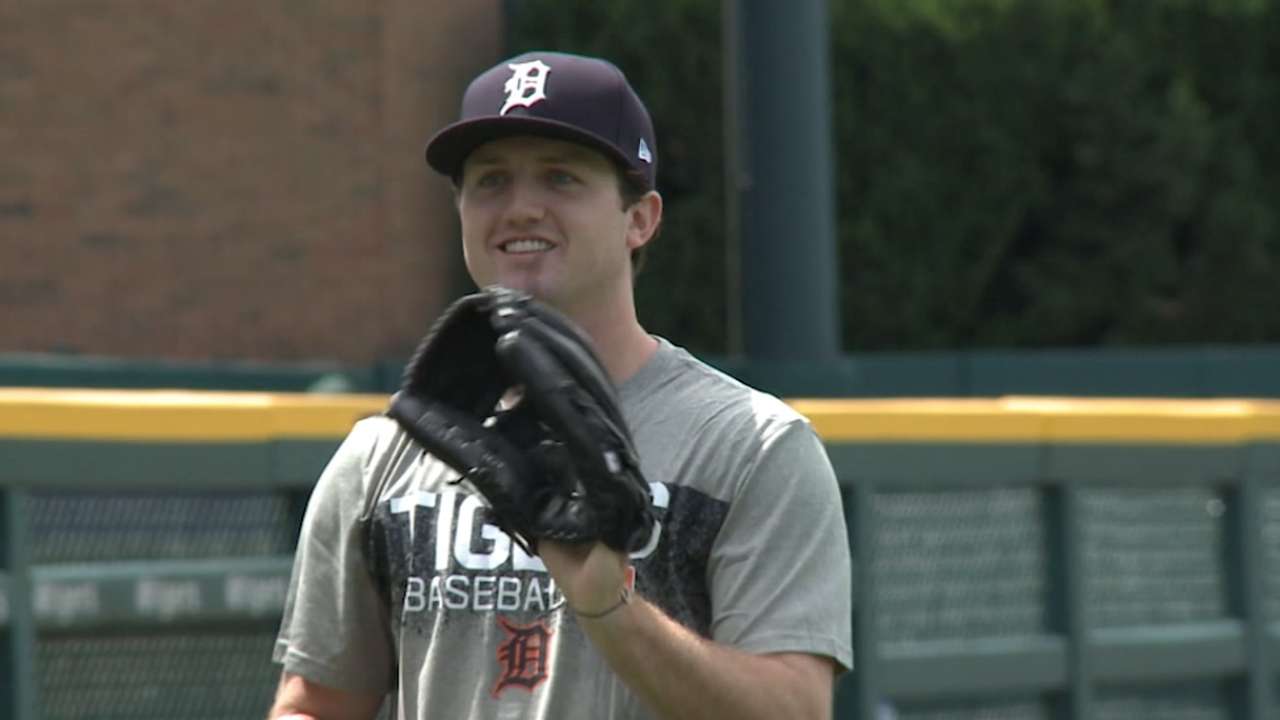
Casey Mize is the Tigers #1 prospect and the #1 overall pick in the 2018 MLB Draft

No question, Casey Mize belongs at the top of this list. He was the #1 overall pick in last year’s MLB draft, and quickly showed why in his brief stint of professional baseball in 2018. Don’t let his ERA in 13.2 innings fool you: he struck out 14 minor leaguers, had a strikeout percentage of nearly 40%, and only walked three hitters out of the fifty-five that he faced across Rookie ball and Class-A Advanced last year.

MLB Pipeline listed his splitter as the best “other pitch” out of every pitcher in the minors which I already regard as a “plus-plus” pitch, and his fastball and changeup are already regarded as “plus” pitches compared to his counterparts in the Majors. He could arguably compete in the Major Leagues right now, but the Tigers will do the sensible thing and let him get his feet wet in the minors for at least the entirety of 2019 (possibly starting where his 2018 ended in A+ Lakeland), and at least a portion of 2020, too.

Mize has an extremely high ceiling as possibly one of the very best pitchers in the game, period, but he also has an extremely high floor, too. Even if he fails to polish his slider and his command, he still likely settles in to any rotation as a middle-of-the-pack starter. He’s certainly someone worth the $7.5 million signing bonus, but my assessment of him also means he merits the time necessary in the minor leagues to obtain the polish necessary to become Detroit’s ace. No need to rush him to the Majors, and for everyone’s sake, I hope they don’t.

2. Matt Manning, RHP

Matt Manning is the only other top-ten draft pick the Tigers have had in the last ten years, drafted 9th overall in 2016. Matt, was drafted out of high school with very very little actual baseball experience. As the son of former NBA player Rich Manning, Matt started out on the basketball court and only started pitching in high school. Scouts quickly recognized his raw strength and athleticism and pegged him to be a risky, albeit intriguing, early 1st rounder in 2016.

I will admit to you, I absolutely hated this draft pick at the time, but saw the merits of selecting him. Manning has extremely raw talent and a low mileage on his arm. Where most high school pitching prospects are already starting to undergo wear and tear in their latter high school years, Manning was just starting to loosen up and air out his fastball. Getting professional instruction while his arm is still fresh gave him a huge advantage over the incoming draft class in both possible longevity and coachability, and he hasn’t really disappointed to this point.

Manning has had some impressive numbers: he struck out 154 in 117 innings in 2018 across three levels of the minor leagues, reaching Double-A Erie, and he even improved in his control: just 43 walks and a WHIP of 1.198. However, there are three major aspects of his development that he will need to come to terms with before ever touching the Majors: his command, the polish on his secondary pitches, and his ability to repeat his delivery. I had a chance to watch Manning during his stints in West Michigan with the Whitecaps, and I can tell you he had issues in repeating his delivery which accounted for some wonky results: I have seen his fastball touch 96 MPH, I have also seen his fastball barely touch 87 MPH in as early as the third inning. He did not appear to be gassed, but his mechanics did appear to be out of whack.

His issues stem from one thing: his rawness as a baseball player. The kid is 6’6″ and is an imposing threat on the mound. His floor is likely as a low-leverage middle reliever, but his ceiling is a number 2 starter. There is a lot of middle ground there that Manning will likely settle into, somewhere between his floor and his ceiling, but his overall numbers in the minors suggest he’ll probably make it to the Majors, someday, as a starting pitcher. He will start 2019 in Double-A, my hope is he stays there all year and puts up gaudy numbers.

3. Beau Burrows, RHP

Beau is another first-round pick of the Tigers (22nd overall in 2015). He has had a slow development: he spent all of 2016 in Single-A West Michigan, split his time in 2017 between Class-A Advanced Lakeland and Double-A Erie, and spent all of 2018 in Double-A. He will likely spend most, if not all, of 2019 at Triple-A Toledo.

Burrows is not an overly dominant pitcher, at least not compared to Mize and Manning. He’s not really an imposing physical threat, and doesn’t really have much that screams “above average pitcher” at you. He has an above-average fastball that can touch the high-90’s on occasion, but he relies on it heavily to get hitters out. He lacks consistency with his 12-6 curve and changeup that will not translate to Major League success. However, he’s still incredibly young, and has put up anywhere from passable-to-good numbers at every level of the minor leagues he has reached.

He really needs to be able to consistently locate and command his changeup. That’s the difference between him being a number 3 and a number 5 starter. Expect him to be one of the first call ups mid-year if a Tigers starter goes down in Detroit. I have a feeling he might see some time in the Motor City in 2019.

4. Alex Faedo, RHP

Another right-handed starting pitcher, huh, Thomas? Don’t worry, I still have one more, and he cracks the top-5. Honestly, the Tigers’ only claim to a good farm system is their right-handed starting pitchers. Without them, they’re still lingering at the bottom of the farm system rankings.

Alex Faedo is, once again, a first-round pick of the Tigers (18th overall in 2017). Unlike the three pitchers listed above, I would argue that Faedo has actually struggled since he entered the league this year. Granted, this year was his first playing professional baseball, and the Tigers did him no favors by inserting him into some of the tougher echelons of the minor leagues that you can start a player, but I am still going to toss a little bit of criticism Faedo’s way.

Faedo’s calling card his is secondary stuff: he has an absolutely nasty slider that is probably the best in the Tigers’ minor league system. His changeup shows flashes of greatness, too, when I analyze his video. I would rate it as average now, which the potential to be a plus pitch. Where he struggled last year was his fastball, and velocity was a problem for him: at the University of Florida, his fastball sat in the mid-90’s consistently, in 2018 between Lakeland and Erie, he was regularly in the low-90’s. With a slider that touches 87 MPH, that’s not much of a speed differential between the two pitches, making it harder to keep professional hitters off balance, and it showed this year. He was unable to miss bats: only striking out a little over 20% of the batters he faced this past year. That is something that he needs to iron out in 2019.

As it stands right now, without any additional zip on his fastball, Faedo is a bottom-of-the-rotation starter, at best. There will not be a place for him in a future Tigers’ rotation if he cannot hone his fastball and add it back to his arsenal as at least an average pitch.

5. Franklin Perez, RHP

Perez was the crown jewel of the 2017 Justin Verlander trade with the Houston Astros. Without Perez included in the deal, the trade would have never gotten done. The Tigers got a sizable haul from the Verlander trade (the other two pieces will be mentioned later in the “5 position player prospects to watch” post), and if Perez pitched a full season in 2018, he could have very well been number 2 or number 1 on this list, but he missed almost all of 2018 with nagging injuries that kept him off the mound most of the season.

Perez lacks the same kind of upside that Mize and Manning bring to the table, but has the same capability of missing bats that they do. All of his pitches grade out to at least average at the moment, along with his command. All he needs to do is stay healthy and stay the course in 2019. Lingering health issues aside, every attribute he possesses as a pitcher has the potential to grade out as above average, making his floor a serviceable MLB starter, and his ceiling a #2-3 starter in a rotation.

Where are the hitters?

If I was doing a top-10, top-25, top-50, top-whatever prospect ranking’s post, none of the Tigers current position players in my mind warrant top-5 status. Not right now. The biggest detriment to the Tigers’ farm system right now is the lack of a truly talented, high-upside position player in their minor leagues. Like it or not, they just don’t have anyone that sparks enough intrigue to warrant a top-5 selection. In all honesty, the only Tigers’ farmhand that has really shown any legitimate potential at all in the last ten years was Nicholas Castellanos. Just Nick. That’s it.

High on the Tigers’ to-do list for 2019 is to invigorate their farm system with high-upside position players, most notably with the number 5 overall pick in this year’s draft. I’m sure they hope to infuse more position player potential with a Castellanos trade, as well, but I worry that they are not going to be able to find anyone with that truly intriguing upside, because even with Castellanos’ offensive ability, he’s a huge defensive liability that makes him less of a commodity to interested teams than someone who is a more complete player.

In other words, the Tigers are going to have to build that pipeline themselves through solid drafting and smart international signings, which is why they are not going to be competitive any time soon.

But I digress, their pitchers are incredibly interesting, and I encourage everyone to pay attention to them in 2019.

Teams Changing Course In 2019 Part 1: Cincinnati Reds

My last post was a pretty scathing review of the lack of competitive spirit in Major League Baseball. This week, I find it appropriate to hand out kudos to teams that are at least trying to change course this offseason to gear up for a 2019 season where they hope to be competitive.

Those two teams are the Cincinnati Reds and the New York Mets. Tonight’s post is a shoutout to my former NL Central rivals: the Cincinnati Reds.

2018 Reds

The Reds promptly dropped 15 of their first 18 contests that prompted the first managerial casualty of 2018 on April 19th as Bryan Price was ushered out the door to make way for interim manager Jim Riggleman. The Reds rewarded their manager by improving to 66-80 the rest of the way. Far from a legitimate threat to make the playoffs, but they went from miserable to interesting virtually overnight.

They also received some great performances from their lineup. Third baseman (and former Tiger) Eugenio Suarez was easily Cincinnati’s biggest surprise: mashing 34 homers en route to a .283/.366/.526 (Average/On-Base Percentage/Slugging Percentage) slash line and contributing a team-leading 4.2 bWAR (Wins Above Replacement), a half win improvement over the previous year and good for 14th in the NL in that category. He did not contribute much with his glove, but his offensive output, despite a .322 BABIP, was encouraging.

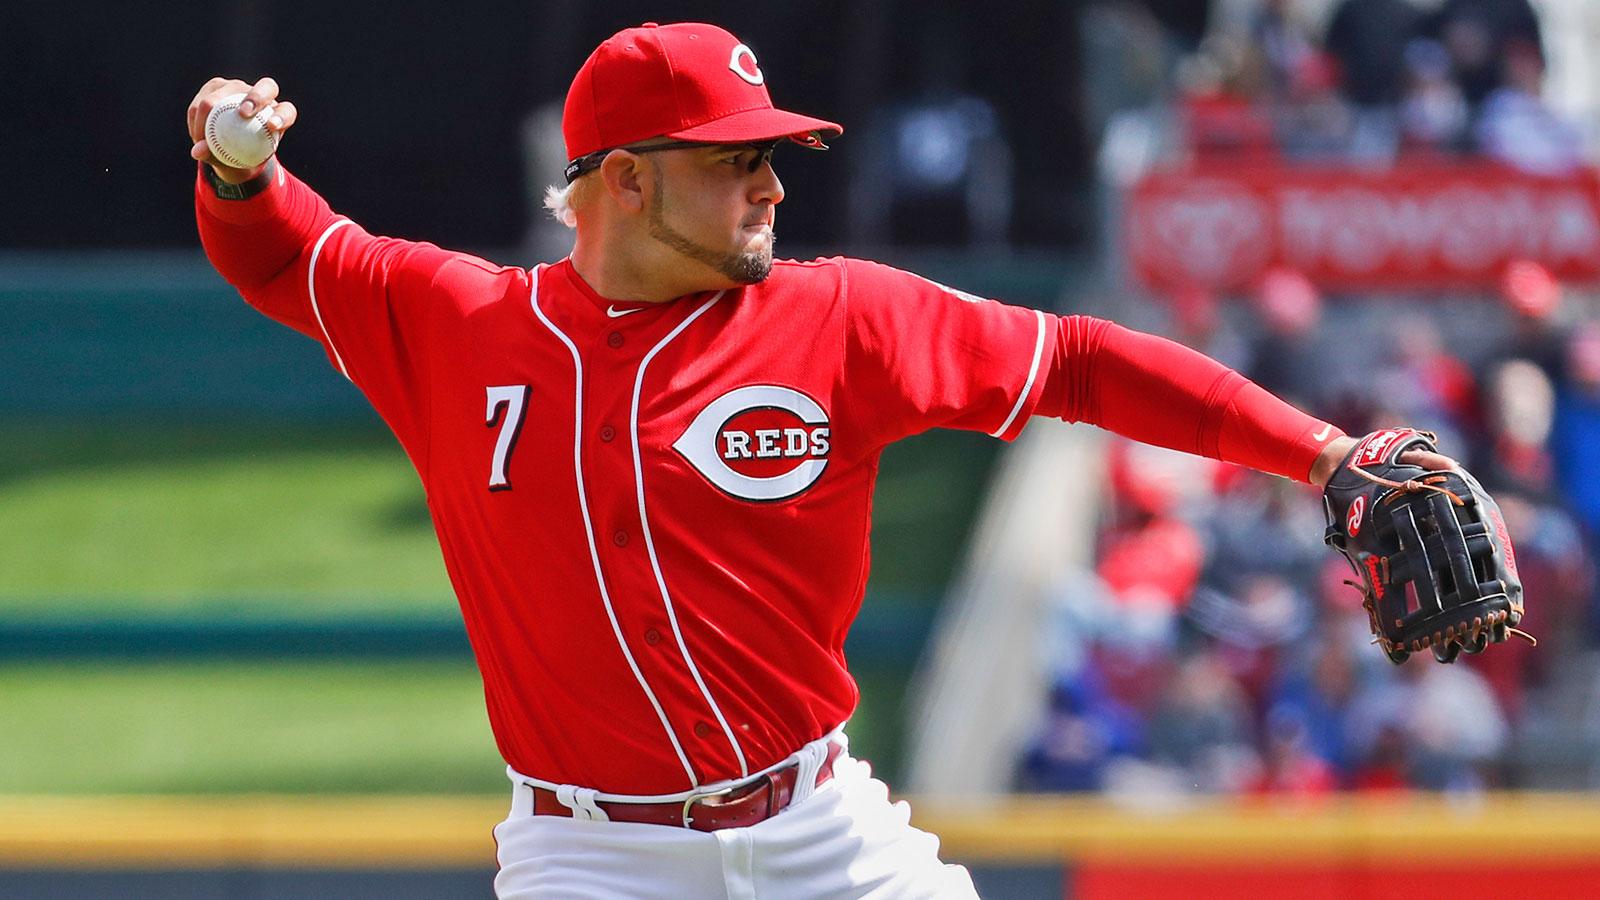
Reds’ Third Basemen Eugenio Suarez

Second baseman Scooter Gennett was right behind him, also possessing a 4.2 bWAR and providing a .310/.357/.490 slash line. He found a home in Cincinnati and the Reds found their replacement for former fan favorite Brandon Phillips.

Reds’ Second Basemen Scooter Gennett

Shortstop Jose Peraza enjoyed a breakout season at age 24: slashing .288/.326/.416 with 14 home runs and 23 stolen bases.

And then, of course, on-base machine Joey Votto contributed a .417 OBP of his own, further solidifying his presence as one of the best players of all time in that category. If there was a OBP Hall-of-Fame, he would get in on the first ballot.

The rest of the lineup provided paltry contributions and their pitchers, outside of their late-inning relievers, were horrible. However, with the Reds fielding a top-10 minor league system, and their young core taking shape with their cornerstone piece being veteran and former MVP Joey Votto, they decided they were close enough to shake things up. They did so in a big way this offseason.

Step 1: Address Starting Pitching

Right from the get-go, it was obvious that for the Reds to be competitive in 2019, they desperately needed to overhaul their starting rotation. Their starters contributed a collective ERA (earned run average) north of 4.50 and allowed 1.4 walks and hits per innings’ pitched. They gave up more runs to opposing teams than any team in the National League. This staff didn’t need finishing touches, it needed to be gutted entirely.

The Reds, compared to just about every other team in the league, moved quickly to address their problems. They started on December 12th, acquiring right hander Tanner Roark from the Washington Nationals for minor league reliever Tanner Rainey, their 23rd best prospect. The Reds paid a small price for a starter who has a career 3.59 ERA, has a penchant for eating innings, and is a prime bounceback candidate in 2019 which is his final year entering free agency. The Reds made a low-risk, high-reward move in bringing Roark into the fold.

Nine days later, the Reds acquired left-handed starting pitcher Alex Wood from the Los Angeles Dodgers in a massive trade that we will continue to address later, dealing away albatross right hander Homer Bailey in the process. Alex Wood has always struck me as an interesting pitcher: he is incredibly gifted and puts up great numbers on a regular basis. His weakness is avoiding the injury bug. Like Roark, he is entering a contract year, and he will need to prove he can stay healthy prior to scoring a big contract. If he stays on the field this year, he’s a resounding improvement over anyone on the staff, and it’s an automatic addition by subtraction for Cincinnati. Homer Bailey has been so bad since 2015, his bWAR comes out to a -4.7 in that time. Alex Wood’s bWAR? 5.5. A massive improvement.

Most recently, the Reds pulled off a trade of Yankees castaway Sonny Gray, trading away their 7th best prospect in Shed Long and giving the Yankees their draft pick between the 1st and 2nd rounds of the 2019 Draft this June. Overall, the draft pick has more value than Shed Long, and though Sonny Gray is a risky choice, it’s the right move for Cincinnati. Gray is one season removed from a solid season split between Oakland and New York and at a time not too long ago he was tabbed as one of the best young pitchers in the entire game. The Reds are betting on a bounceback campaign from Gray just like Roark, and are putting additional faith in him by extending him an additional three years beyond this one with an option for a fourth year.

Sonny Gray was one of the game’s rising stars as the ace of the Oakland A’s, will he recapture that magic in Cincinnati?

All of this without signing a single Major League free agent, and several tantalizing free agents still on the market. The Reds have dramatically overhauled 60% of their rotation, and I am willing to bet they aren’t done.

Step 2: Add Offense Around The Core

As I have already established, the Reds have an already impressive core of Joey Votto, Eugenio Suarez, Jose Peraza, and Scooter Gennett. The Reds don’t have the payroll capabilities of big market clubs, and wanted to supplement their core with solid offensive contributors while top offensive prospects Nick Senzel, Tyler Trammell, and Jonathan India receive necessary seasoning in the minor leagues.

Enter the Los Angeles Dodgers and the remaining pieces from the Alex Wood-Homer Bailey trade.

In exchange for two solid prospects, the Reds acquired outfielders Yasiel Puig and Matt Kemp from the Dodgers in addition to Alex Wood. Both outfielders are entering walk years where they will be free agents at season’s end. Puig has tantalized baseball with his strong throwing arm and massive raw power, which translated into a slugging percentage of .494 last year, a massive upgrade when stacking him against any of Cincinnati’s outfielders from the previous year.

Yasiel Puig brings an infusion of power and passion to an already talented Reds’ lineup.

In addition, Kemp, although he struggled down the stretch, performed well enough in the first half of 2018 to earn an All-Star Game appearance and still managed a slash line of .290/.338/.481 contributing 21 homers while playing half of his games in spacious Dodger Stadium. Kemp also gets his chance at the free agent market at season’s end, and his last chance to net a sizable contract in his productive, and occasionally remarkable, career. He’s still a significant offensive upgrade over any outfielder the Reds fielded last year, and entering a contract year, coupled with playing in hitter friendly Great American Ballpark for half the year, gives both Puig and Kemp the opportunity to play their best baseball. That gives the Reds six good-to-potentially-great hitters in their lineup, all while adding only $7 million in new salary to their team in a trade that netted them four players (the other being a minor league catcher). Another high reward trade that adds minimal cost to their overall payroll.

The Reds still have work to do: they’re still likely the fourth-best team in their division. The Milwaukee Brewers won the NL Central and the had the league’s best record last year, and already improved their lineup. The St. Louis Cardinals were the last team eliminated from playoff contention last year and added perennial MVP candidate Paul Goldschmidt from the Diamondbacks, and the Chicago Cubs have mostly stood pat, but they were a game away from winning the NL Central last year and didn’t get any worse. The Reds have to play remarkable baseball to have a fighting chance at making the playoffs next year.

But, damn it, they gave it their best effort to field a good team next year. The NL Central will be a hell of a lot of fun to follow in 2019.

The Game Is Broken: How Do We Fix It? Part 1: Mediocrity

Be honest with me here: when was the last time you have been genuinely excited about baseball?

Most of my friends and family adore the Detroit Tigers. It is an undeniable fact. The last time the Tigers played any meaningful baseball was in 2016 as they faded from playoff contention during the regular season’s final moments. The last time they played exciting baseball was two years earlier as they marched to their fourth consecutive American League Central title. They were promptly handed three straight losses in the Division Series to an arguably inferior Baltimore Orioles, and the rest is history: they have been anywhere from mediocre to abysmal ever since.

Watching teams that suck is no fun. That’s obvious. But even organizations that have put together talented rosters have made the game a chore to watch.

It is no big secret that after working for the Milwaukee Brewers, I have become an avid fan. This year, by win-loss record alone, they were the best team in the entirety of the National League. I watched every single postseason game, and even I found myself having a difficult time staying focused:

The constant pitching changes, pinch hitters, double switches, defensive substitutions! The gameplay stoppages were a regularity. There were a fair share of shorter games this postseason, and the overall length of an average game is shortening, but there were several that crept beyond 4 hours in length.

The pace of play is an issue, no question, but the biggest culprit of the lack of excitement stems from my first point: watching teams that suck is no fun.

MLB’s revenue has never been higher. It eclipsed $10 billion in revenue in 2017 and has increased every single year for the last 16 years. However, MLB’s attendance rate is declining. It dropped 4% in 2018, and it dropped in 2017, too. MLB’s theory publicly is that inclement weather in March and April sabotaged any chance of an attendance increase this year. My theory is much more honest:

No one wants to pay to watch a mediocre product.

Tanking

Tanking has gained prevalence in professional sports lately. From the NBA’s Philadelphia 76’ers “Trust the Process”, to the 2015-2017 World Series Champions: the Kansas City Royals, Chicago Cubs, and Houston Astros. Each one of these teams rose to prominence by completely gutting their rosters, enduring grueling seasons with hardly serviceable players and hundreds of losses between them, all to obtain top draft picks to build a championship team from the ground up. These teams saw an opportunity to take advantage of revenue sharing in their years of futility and use that as fuel to fund their ailing rosters. After many, many, many years of rebuilding, they got theirs: a World Series Championship.

In theory, this is a solid baseball strategy. The teams reap the benefits of the successes of others to stay financially profitable as fans stay home, and they come out in droves when the product is appealing again. The problem, and stark reality, is this: more MLB teams are doing this than ever before.

The age of analytics allows all teams to have access to the same information, and teams are starting to evaluate wins the same way. Their roster building strategies are becoming more black-and-white: a collection of cheap, controllable players who have exclusive negotiating rights with their team for multiple seasons is far more valuable to them than one superstar free agent on a $300 million contract (looking at you guys, Bryce Harper and Manny Machado). The way MLB teams conduct business is changing, and no team is a better example of this than the New York Yankees.

The New York Yankees: A Brief Case Study

The Yankees used to be big spenders in the free agent market. It’s not a secret, it’s public record. The Yankees used to spend hundreds of millions of dollars on free agent players like Alex Rodriguez ($275 million in 2008), C.C. Sabathia ($161 million in 2009), and Mark Teixeira ($180 million in 2009). From 1999-2013, the Yankees opened the season with the highest payroll in baseball. Then, in the 2016 offseason, something very interesting happened:

The Yankees’ payroll dropped, significantly. When the Yankees opened their season in 2016, their payroll eclipsed $213 million, in 2017, it was $168 million. Their payroll was virtually identical in 2018, but they dropped five spots in overall spending, from second most in the league to seventh.

What changed in their overall philosophy? Behind the scenes, they were undergoing a massive overhaul of their minor league pipeline of talent. Stars like Aaron Judge, Gleyber Torres, Gary Sanchez, Luis Severino, and Miguel Andujar were called up to the Big Leagues, as expensive stars like Alex Rodriguez, Mark Teixeira, Mariano Rivera, and Derek Jeter made their exits. The team is still saddled with expensive contracts like Giancarlo Stanton’s or Jacoby Ellsbury’s, but they are not making major long-term offers to star players any more. In fact, no one really is.

Free Agency Dormancy

Free agent spending is decreasing, and the lengths of contracts being signed by free agents are getting shorter. In the 2017-2018 offseason, there were 203 professional free agents in MLB. Of those, five free agents signed a contract for longer than three years. Five. The 2018-2019 offseason has not ended yet, but the numbers are even more jarring: as of this post, the number of free agents who have signed a contract longer than three years is a measly three. When it’s all said and done, there will assuredly be more (looking at you guys, Bryce Harper and Manny Machado), but we are less than a month away from pitchers and catchers reporting for Spring Training, and most of the league’s most talented free agents are still sitting at home and working out without a contract. That’s extremely problematic.

So, the big question is why? Why aren’t teams spending money to help them win a championship? The answer is simple: it is a better baseball strategy, and a better economic strategy, to build your roster through tanking and rebuilding.

The Tangible Impact of Tanking Through the Eyes of a Front Office vs. The Fans

Here’s the bitter reality of baseball today: if your team is not a sure fire bet to make it to the postseason, then you have to do something to set your team up for long-term success. Through the eyes of a fan, it is fairly easy to see a marked performance difference between an 85 win team that did not make the postseason and a 50 win team that did not make the postseason. When I think about it in the context of a front office building a roster, I just see a team that did not make the postseason. Teams have no long-term benefit trading cheap and controllable potential big leaguers for established rental players eligible for free agency in the short-term if it does not net them a postseason appearance, plain and simple.

During the season, July 31st and August 31st are big days in determining the landscape of baseball: it’s MLB’s non-waiver and waiver trading deadlines, respectively. I could explain the nuances of each to you, if you wish, but the important takeaway from those two dates is that they are the last opportunity a team has to acquire the rights to a player already contracted to another team. The lead up to these dates establish “buyers” and “sellers.” If your team is pushing for a postseason berth, they are likely to be buying established MLB talent. If they are not, they are selling off their established MLB talent in exchange for players, cash considerations, and some unrestricted draft picks in the following year’s amateur player draft.

More than ever, teams are reluctant to “go for it”, and it has become a seller’s market. Teams that are buying are finding that the asking price for players on other teams are exorbitantly high, and sellers are finding the competition crowded because every other team out of contention is trying to do the exact same thing they are. Teams value minor league talent and cost-controlled players higher than ever before, and it is leading to a diminished product as collateral damage. Every team that is out of contention is trying to become the next Kansas City, Chicago, or Houston, and that extends to the buyers as well.

The buyers: the Boston Red Sox, Houston Astros, and New York Yankees each walked away from 2018 with over 100 regular season victories. Eight other teams finished with 90+ wins. Of those eleven teams, one of them didn’t make the postseason: the Tampa Bay Rays. What’s the difference between the 90-win Tampa Bay Rays and the 115-loss Baltimore Orioles? A lot, but they share one thing in common: neither played in October.

Meanwhile, 14 teams finished with losing records. Nearly half of baseball. Fourteen teams tried to sell their players to eleven buyers, creating a slew of trade rumors, much of it with little to no traction. Though some will not openly admit it, the overall strategy was to better their draft positioning for next year, where they can dip into the amateur player pool to spend a fraction of the money they would spend on free agents on players they control for six years or more.

How Does This Change?

I think the way the business is structured is a big reason why this mediocrity problem exists, and it starts with expanding postseason play. Major League Baseball has the smallest potential window of postseason opportunity than any major sport in North America: only 33.3% of their teams are eligible to play in the postseason. Compare that to the NBA, where 53.3% of their teams are eligible. Even the NFL, the second most exclusive postseason market, grants 37.5% of their teams the opportunity to compete for the Super Bowl.

There are only two realistic scenarios: the inclusion of one more wild card team in each league, or two wild card teams in each league. The inclusion of one additional wild card team opens up an NFL-style postseason bracket: the two best division winners in each league receive a first round postseason bye, and the other four participants either play a one-game playoff or a three-game series (I personally prefer three-game series, give every postseason participant the opportunity for at least one home playoff game). The rest of the postseason can be played as it usually does: a five-game Division Series round, and a seven-game Championship Series and World Series.

The second scenario is a lot easier to envision if two things happen: one, MLB expansion brings in two more teams, bringing the league to 32 teams, and two, the regular season is shortened to 154 games (I will get into this in a lot more detail in a future post). Shortening the regular season with a 32-team league has been well researched and I suggest Googling some of the benefits of what a shortened season could do for scheduling purposes, but the greatest opportunity to come of a shortened season is an expanded postseason that does not lag into November. Sixteen MLB teams, or half the league, would have a legitimate shot at a World Series title in an NBA Finals or NHL Stanley Cup Playoff-like bracket with the 1-seed pitted against the 8-seed in the opening round, the 2-seed against the 7-seed, and so on. Teams would be less apt to race to the bottom, and teams would be more willing to trade and sign players to chase a World Series title. Even teams on the fringes of contention would have a legitimate shot of getting into the playoffs as the 8-seed and knocking out the 1-seed en route to a Cinderella story World Championship. The Los Angeles Kings won a Stanley Cup that way not that long ago, and though an 8-seed has ever won the NBA Finals, an 8-seed has won their conference championship. Baseball can be far more fickle than either sport, 8-seeds are legitimate threats in MLB.

The other option that I think is worth exploring is shortening the free agency clock from six years to four. In Major League Baseball, players must accrue 6 years of MLB service time before they are eligible for free agency, accrued through being on a MLB roster (either active roster or MLB disabled list) for 172 days. Teams constantly work around this guideline by waiting a few weeks into the season before calling up a minor leaguer to the big leagues, effectively giving a player less than 172 days of service time and another year of team control. Giving teams less of an opportunity to hold on to cost controlled players and giving players more bargaining power opens up the free market and forces teams to spend on the players they want to keep or go after. Personally, I think this cannot be implemented without a hard salary cap or stricter luxury tax stipulations, but it’s another idea to keep the competitive nature of the game strong.

It’s Not a Simple Problem

…and because of this, there is no simple solution. The reality is that the product is mediocre, and more players than ever before are getting the bad end of the bargain because of it. That requires a difficult conversation likely to come in 2021 when the Collective Bargaining Agreement expires, along with some drastic changes. I will visit some of those changes in Part 2, coming soon.

Welcome To My Blog

In an effort to build a better baseball portfolio, I am going to start creating new media to share my insights on the state of the game, and anything else. This blog is the start, with a podcast coming soon.

A little about me: I was introduced to baseball at a very young age. I played the game from age 5 to 17, only taking it seriously the last four years of my playing career. I fell in love with the game in 2006, during the Detroit Tigers’ postseason run that captured an American League pennant and a World Series matchup with the St. Louis Cardinals that fizzled quickly in 5 games. From that October onward, I became a kid obsessed with the sport and quickly scrambled to find ways to keep myself involved.

In 2014, that passion developed into something tangible: I was hired on as a Baseball Operations intern in the Milwaukee Brewers front office. It was my dream come true. That internship gave me invaluable insight into how a front office operates, the economics that make up the industry, and an education on how to evaluate talent on both an amateur level and a professional level. Ever since that internship ended, I have still been in a constant pursuit of knowledge, and this blog, I hope, gives me an opportunity to showcase that.

My blog will cover all aspects of the game: scouting, analytics, players, economics, and much much more. I will always be a work-in-progress, and no matter where this blog takes me, I will always be a fan.

See you soon.

Design a site like this with WordPress.com
Get started